Smart Cities Mission: Implementation and Financing
Background
On June 25, 2018, the Smart Cities Mission was officially launched under the Ministry of Housing & Urban Affairs. Since the launch, 100 cities have been selected under the scheme – with the announcement of Shillong as the 100th city just last week – and the Union government has proposed to invest Rs. 2,05,018 crores towards improving their infrastructure, access to government services and quality of life. On the three-year anniversary of this scheme, it is important to see how it has been implemented and how cities have made progress under the Mission.
In order to be selected as Smart Cities, cities across India prepared Smart Cities Proposals to undertake city-wide initiatives (such as smart metering of water or intelligent transportation design) as well as plans to develop or retrofit particular regions of the city. The projects were meant to be inclusive in nature and reflect citizen inputs and feedback. Selections were made across five rounds between January 2016 and June 2018.
* Due to elections being held in Meghalaya in February 2018, Shillong’s proposal could not be submitted in January and it was approved only in June 2018.
As per the Smart City guidelines, each selected city is to receive up to Rs. 500 crores in central grants over five years. In addition, an equivalent amount must be contributed by the state and municipal governments in partnership (with urban governance bodies known as Urban Local Bodies or ULBs). The funds released from the centre so far have totalled Rs. 9,939 crores, or roughly 5 % of the total proposed. Information about whether the states and cities have provided equivalent funds is tracked through the government’s Public Financial Management System (PFMS) and are reportedly often delayed. The remainder of funds required for projects is envisioned through other grants, loans as well as revenues raised by cities themselves through taxes, user charges and by floating municipal bonds.
Though the mandate for implementing projects under the Smart Cities Mission belongs to Special Protection Vehicles (SPVs), established by the state government and ULB together, the day-to-day operation of the city and its services remains primarily the responsibility of the municipal government. With over 37.7 crore people living in urban areas and an estimated growth rate of over 30 % (Census 2011), the cooperation of the central, state and municipal governments is essential to make funds available, ensure infrastructure is maintained and upgraded and enable inclusive and participatory urban governance.
How much progress has been made on Smart Cities projects?
The first infographic depicts the cities that were chosen in the first three rounds of selection and how many projects have begun under each. According to the Ministry of Housing and Urban Affairs, a total of 3,008 projects had been identified in the first 90 selected cities selected in the Mission. Of these, only 753 or 25 % have begun. The number of projects that have been completed is even lower at 243 (8%).
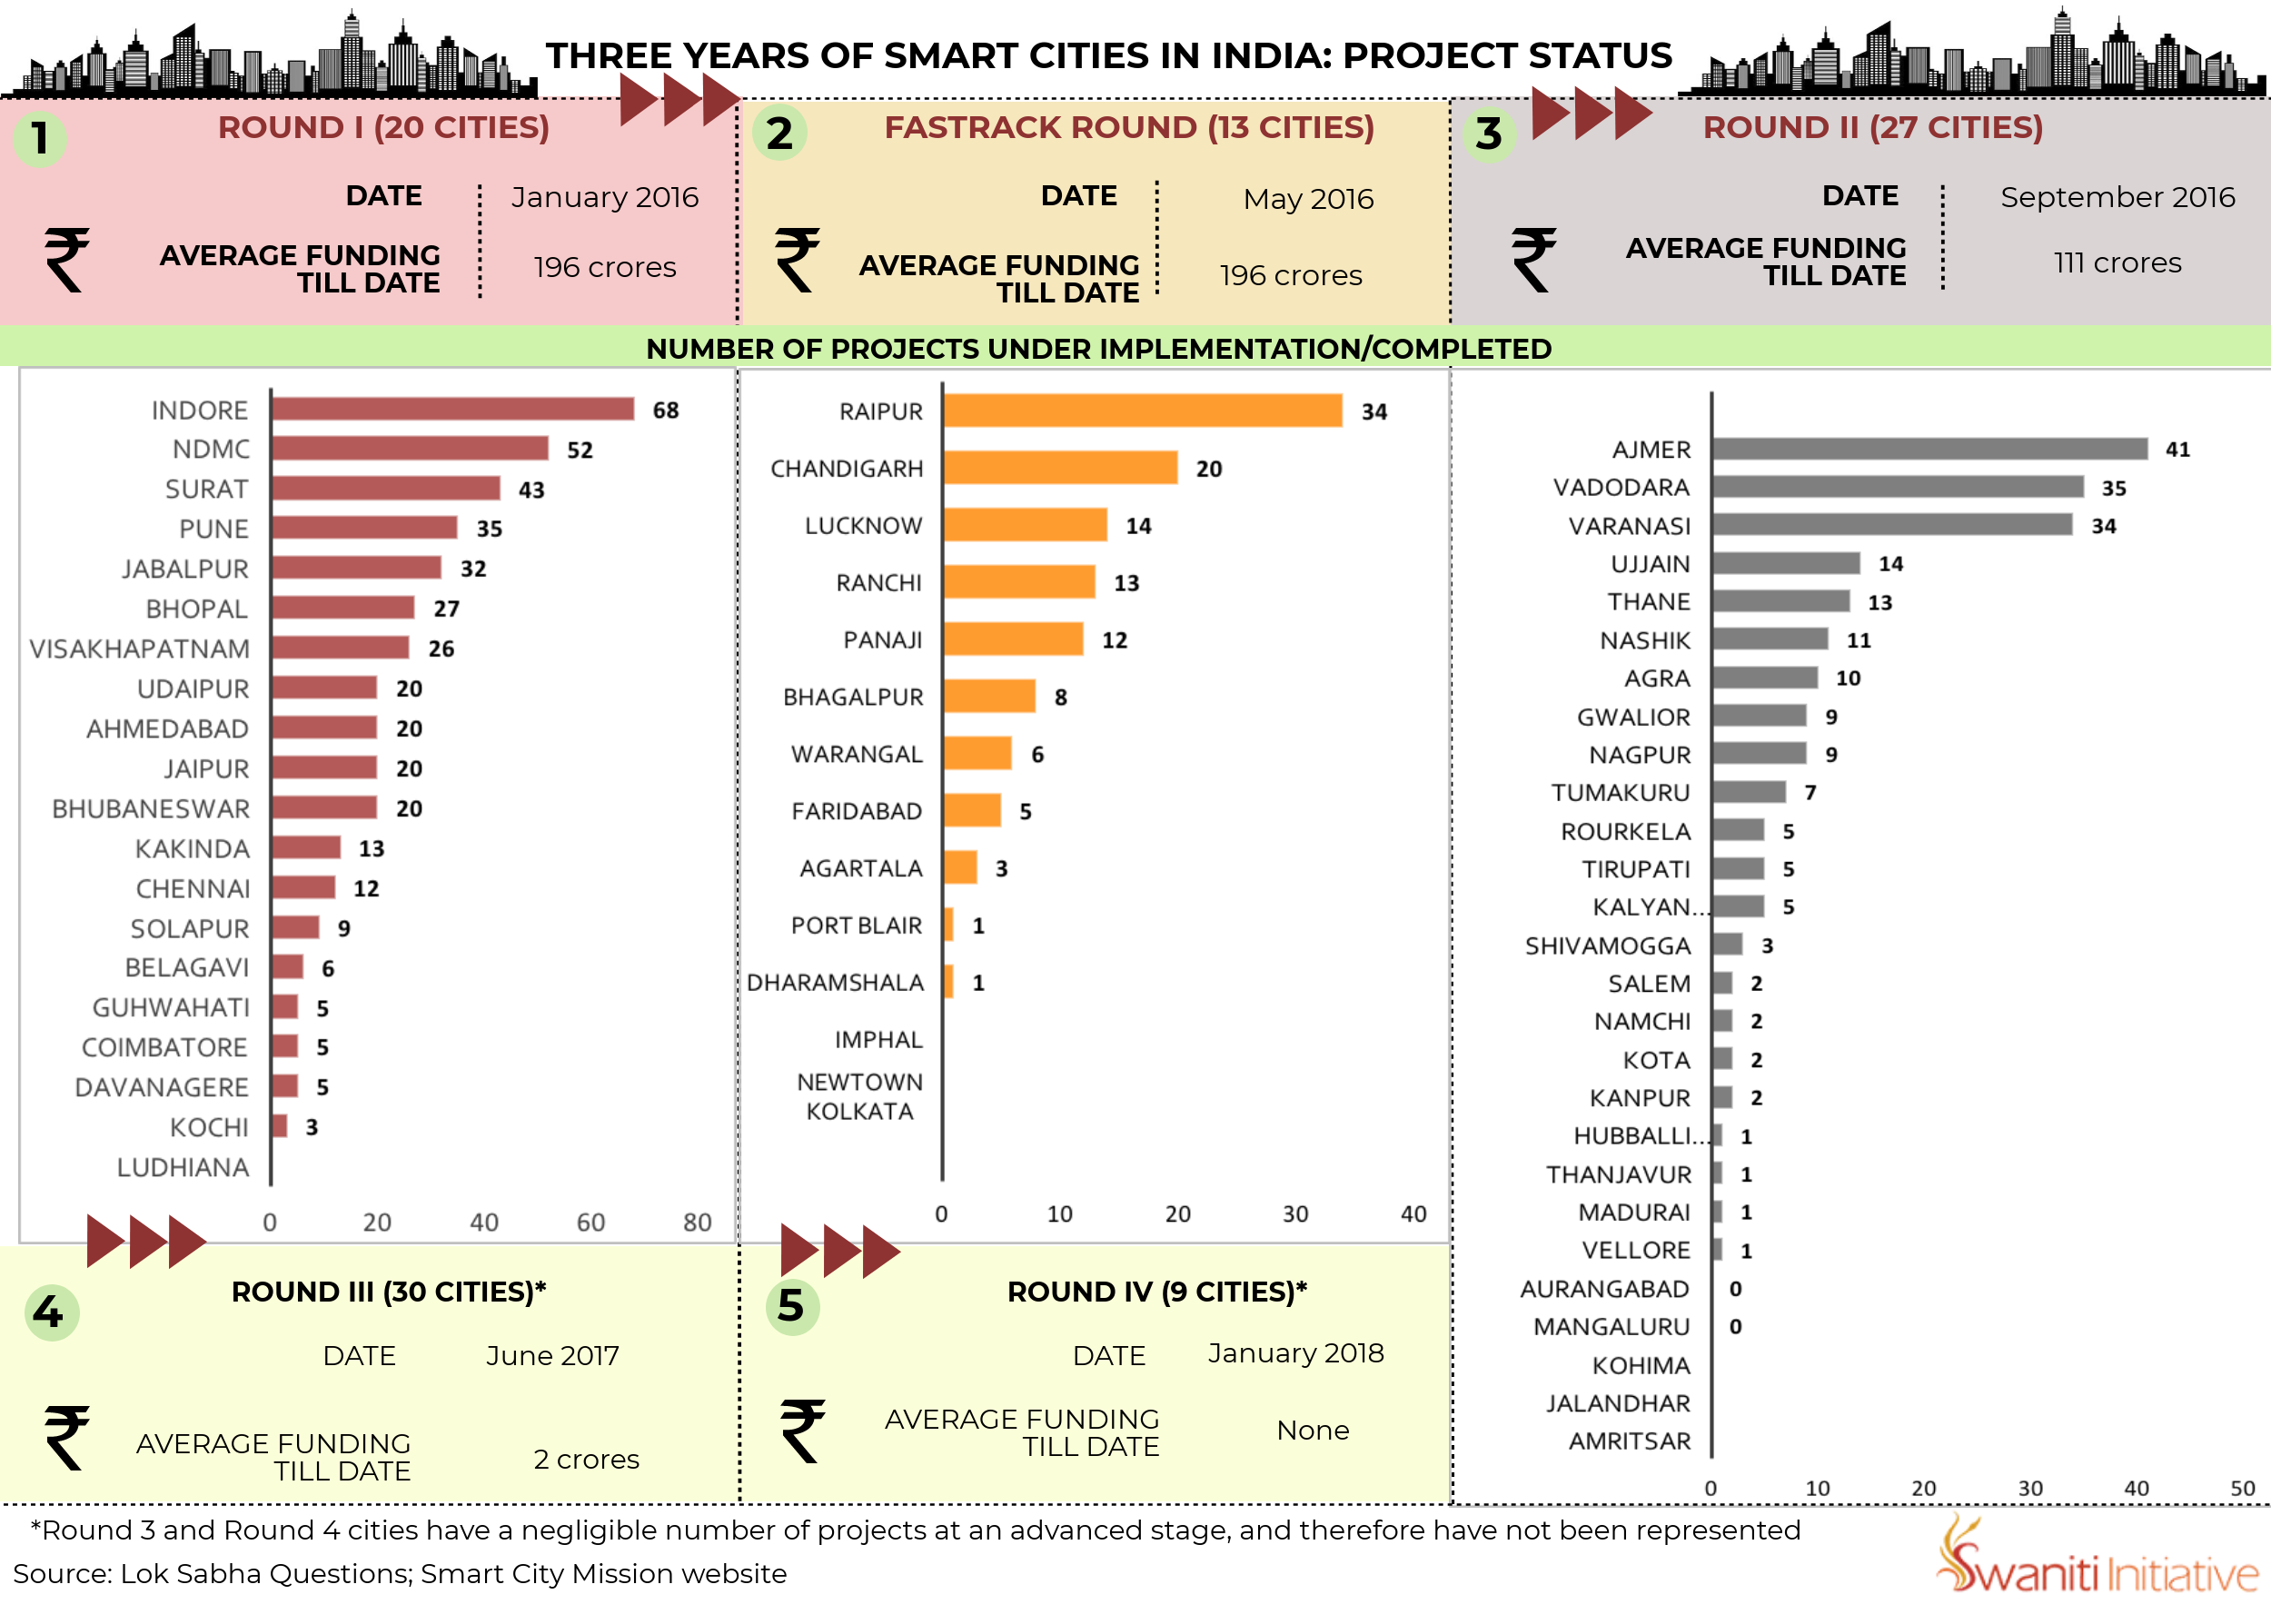
Out of the top 10 cities, six are from the first round, three are from the second round (Ajmer, Vadodara, Varanasi) and only one (Raipur) is from the Fastrack round. The city that has begun the maximum number of projects is Indore with 68 projects, followed by New Delhi (52) and Surat (43).
Therefore, in the first three years, much of the preparatory work – forming SPVs to implement Smart Cities projects and beginning the tendering process – has been underway. The funds actually disbursed from the central government has been a small fraction of the total committed and progress on Smart Cities projects has been slow.
How can Municipal Governments contribute towards Smart Cities financing?
As the funds required from central and state governments take time to materialise, ULBs empowered under the 74th Constitutional Amendment must find ways to make up the gap. The second infographic examines the financial position of eight selected Smart Cities by assessing the tax revenues reported within their annual budgets over a four year period.
The decision as to which taxes may be levied in cities and how much of it goes directly to the ULB vary from state to state. While the staples (property tax, advertisement tax and entertainment tax) remain constant, other municipal taxes include octroi (a local tax on entry of goods levied only in Gujarat, Maharashtra and Punjab; it ceased with the introduction of GST), profession tax and a range of cesses from education to urban development.
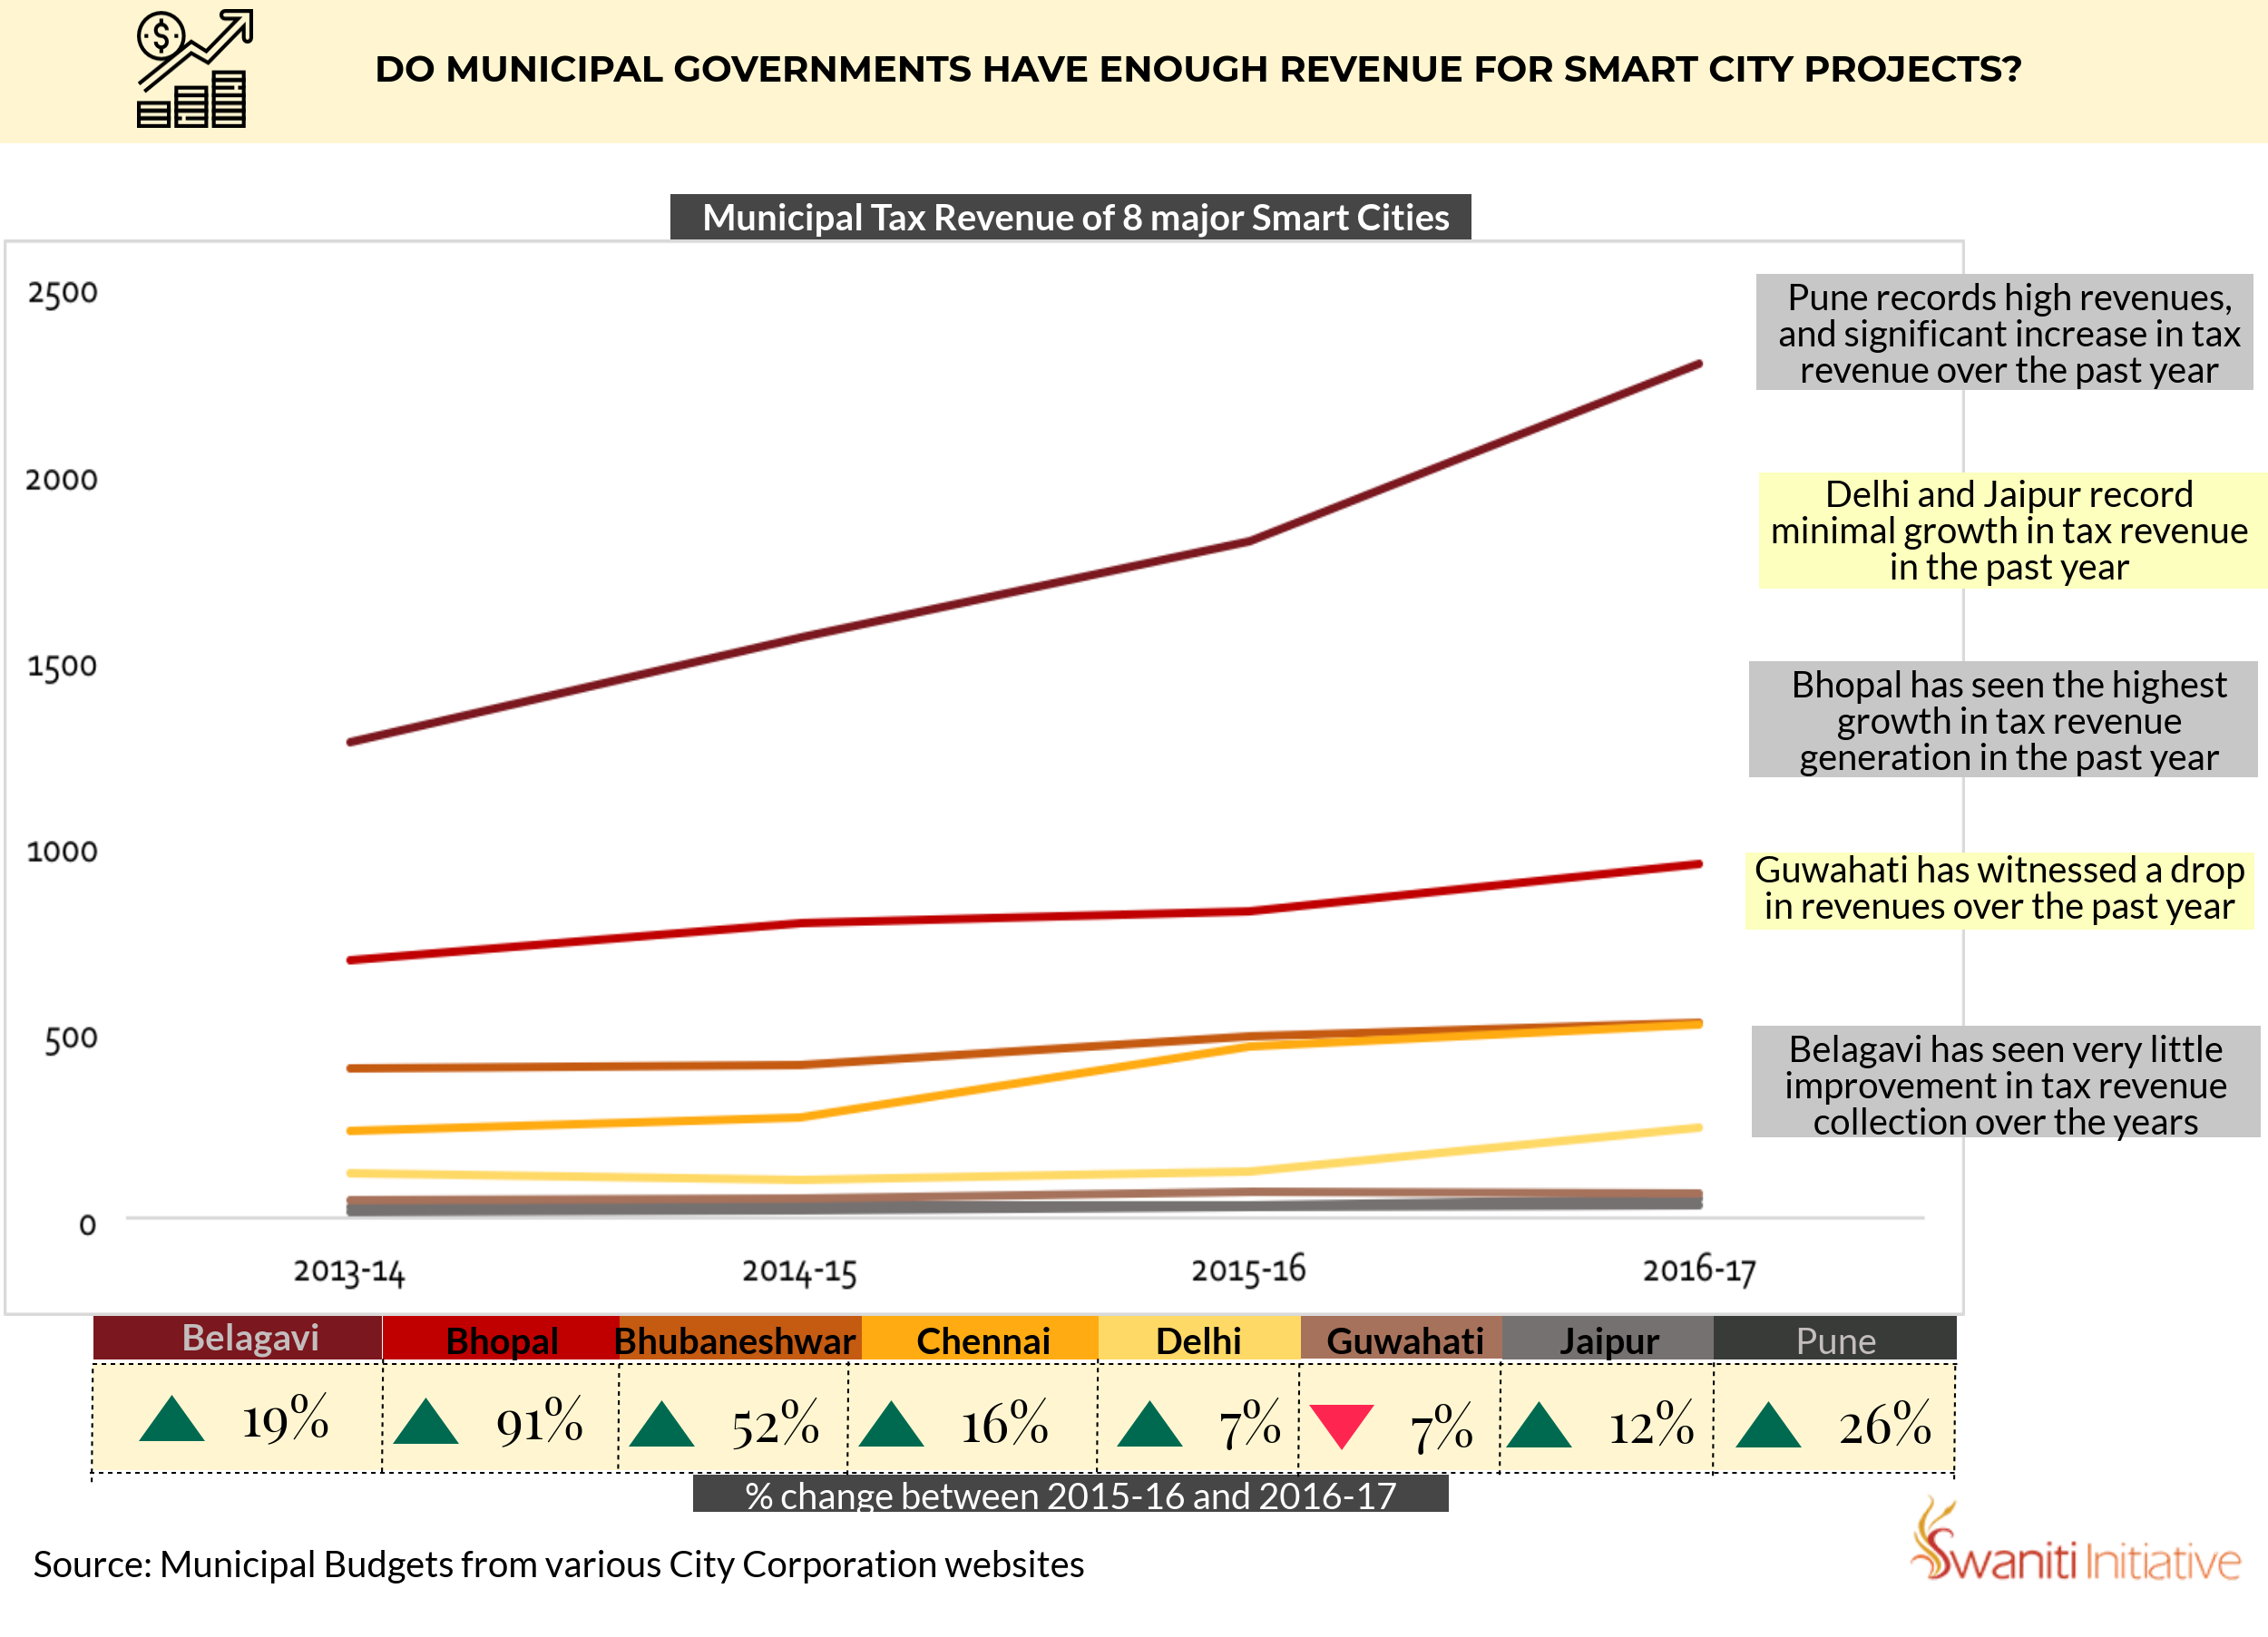
From this analysis of the taxes reported between 2013-14 and 2016-17 i.e. two years before and two years after Smart Cities began, we can see that there has been large variation between the trends in cities. While some cities like Bhopal, Bhubaneswar and Pune saw tax revenues increase after their announcement as Smart Cities, many others remained constant. Therefore, gaining the status of a Smart City did not have an immediate impact on the tax position of many of these cities. As they began projects, the actual position of the ULB to back them did not significantly improve – meaning that the Smart Cities Mission as it has begun leaves cities heavily dependent on the grants from the central and state governments.
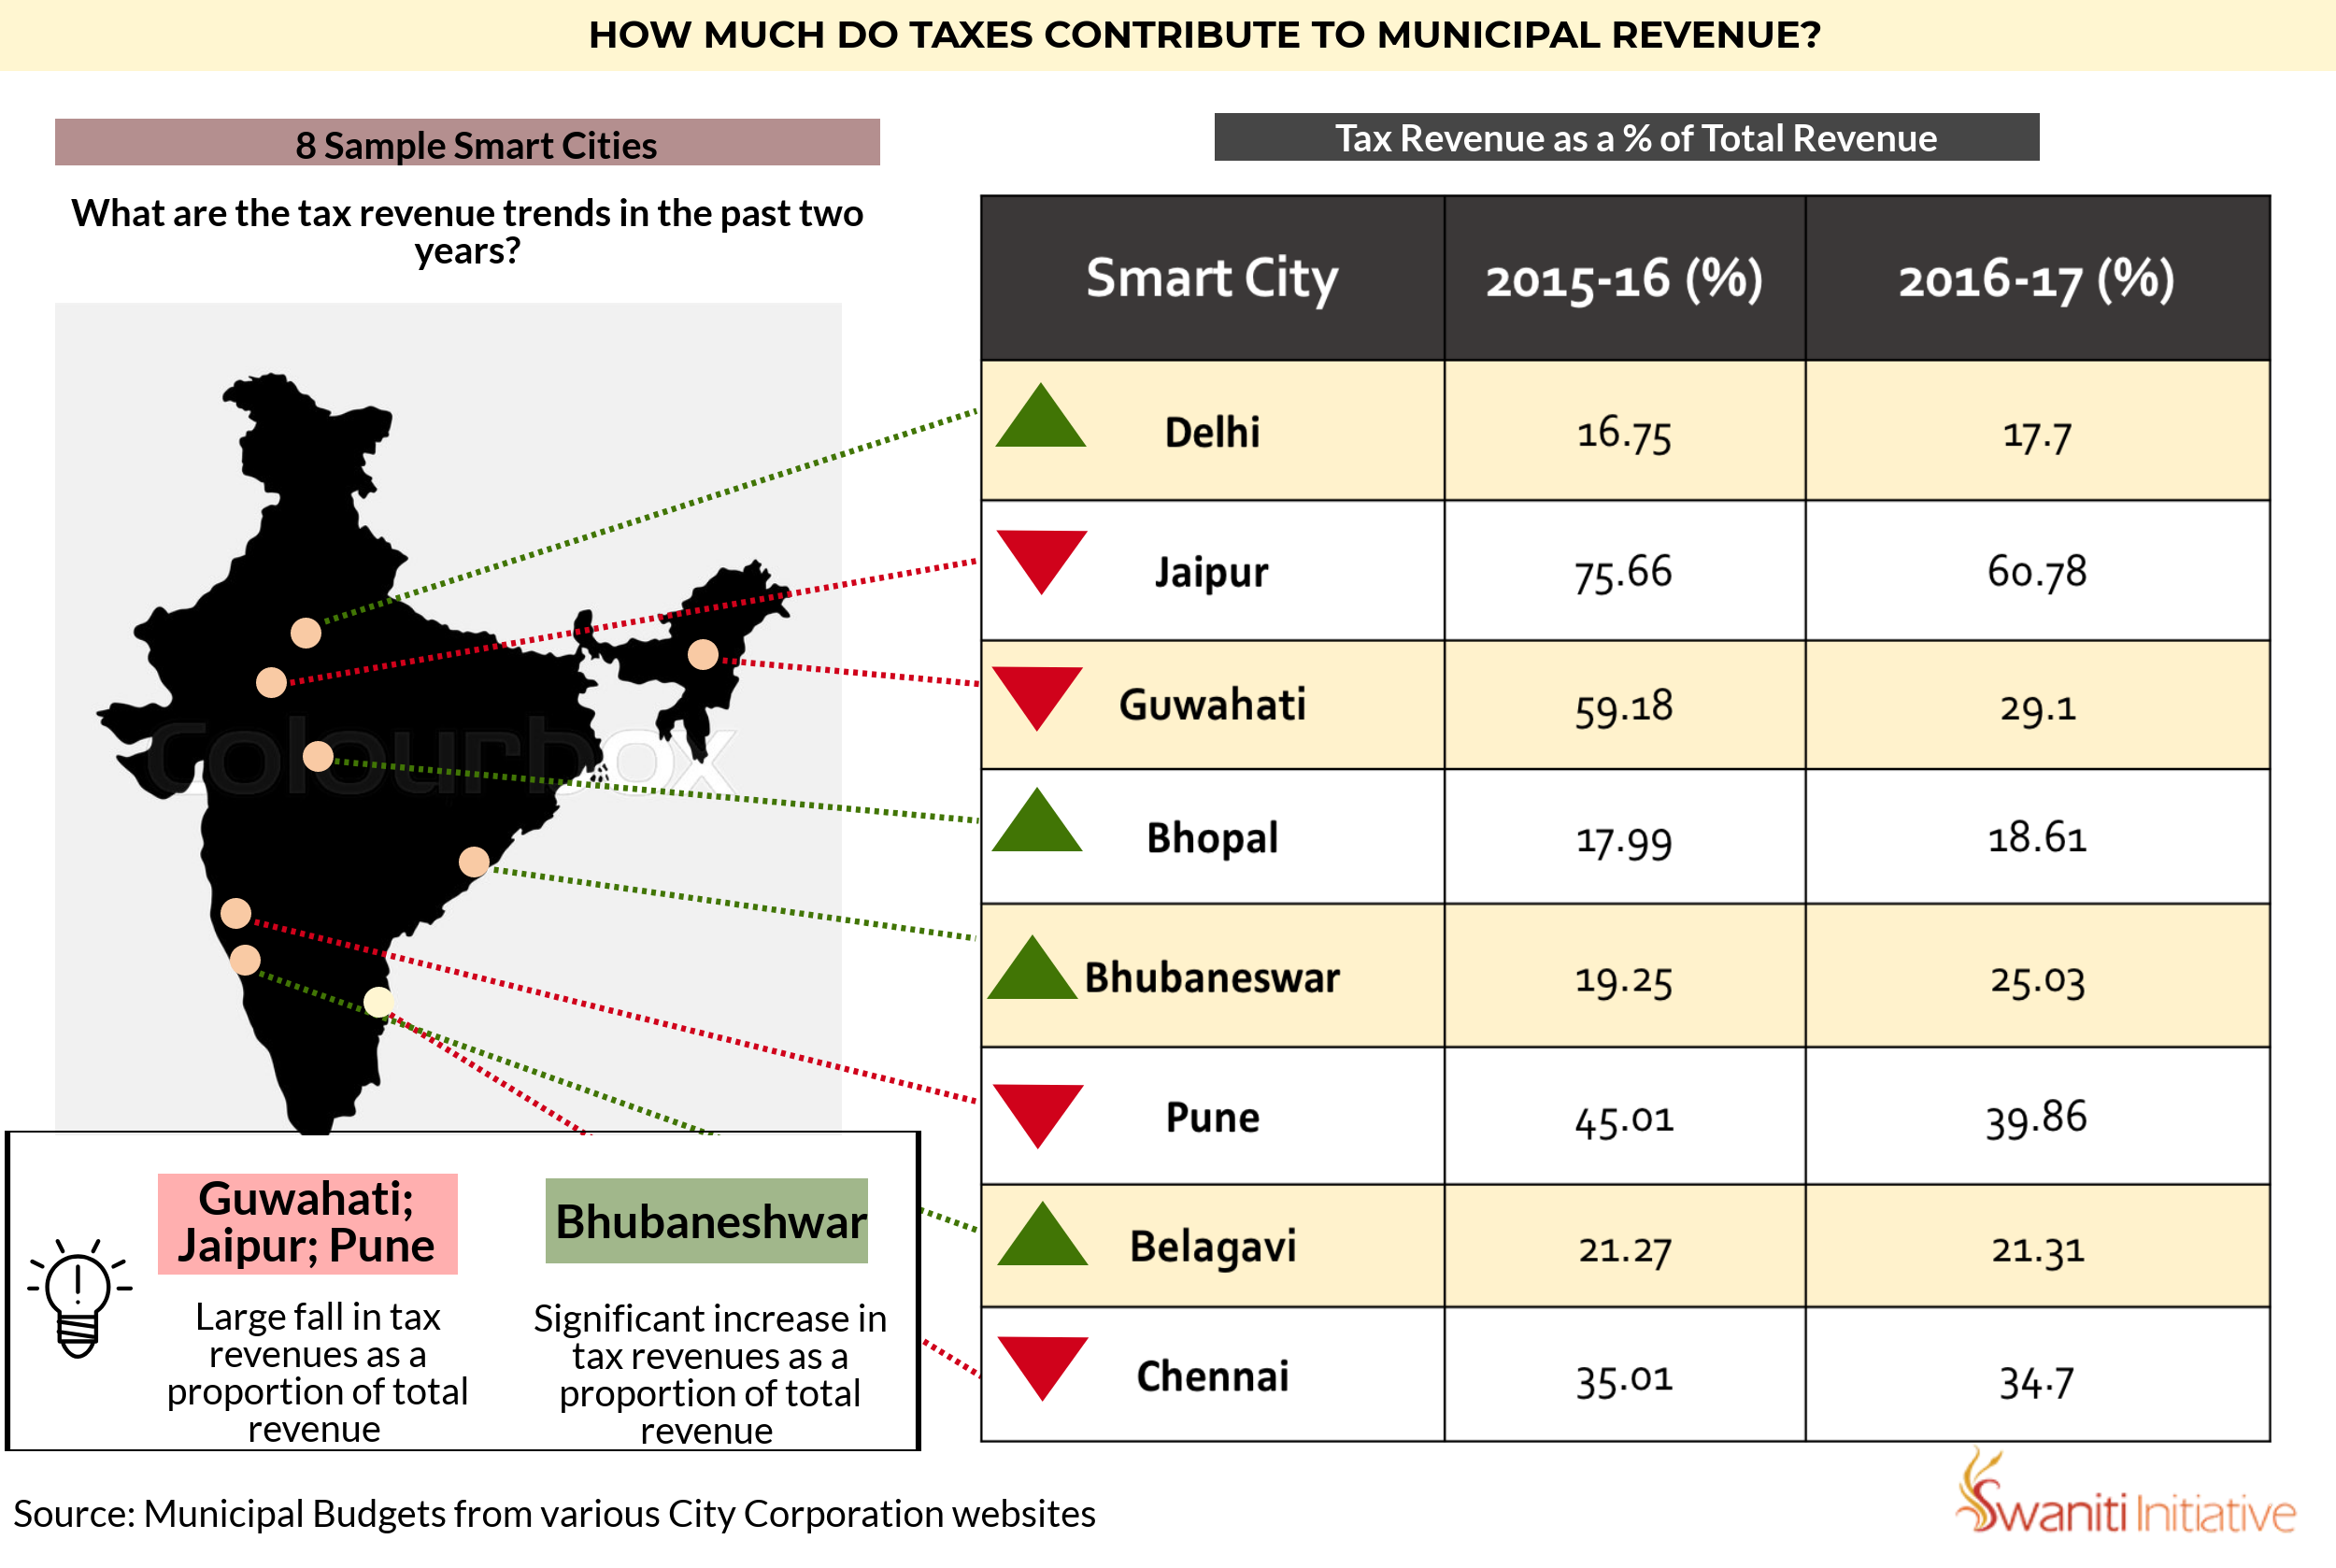
In addition to absolute figures for tax revenues in these eight cities, we also examined the share of taxes within total revenue. The remainder of revenues are mostly made up of grants and compensations from the state governments, rental incomes of municipal properties and fees and user charges. The third infographic reveals municipal taxes as a percentage of total revenues in the same eight cities and whether it increased or decreased in the two years after their announcement as Smart Cities.